Q3 2025 | Quarterly Newsletter
- Spectrum Investment Advisors

- Jul 15, 2025
- 8 min read

Newsletter Snapshot:
EquityMarketsrebounded to new highsfrom the April lows.
Tariffshit faster than expected - marketsdigest policy shift.
Bondsprovided positive returns and were a ballast in diversified
portfolios.
Written by:

Following a volatile start to 2025, markets rebounded and generally posted positive returns through the first half of the year. April had both a pull back and rally all in one month, as President Trump announced unexpectedly high tariffs and one week later he applied a 90 day pause on those tariffs. May and June continued to provide positive returns as investors moved past the peak uncertainty. The S&P 500 ended the quarter up 10.94% from April through June. International stocks rose 11.78% (MSCI EAFE Index) and the Bloomberg U.S. Aggregate Bond Index rose 1.21%. Since the start of the year, a sample portfolio with 60% stocks and 40% bonds diversified across these three indices produced a positive return of 7.71% through June 30. 2025 has brought with it a lot of headlines that have moved markets.

Events of the first half of 2025 highlight a few key investing principles to remember.
Stay diversified. International equities lagged U.S. equities for most of the past decade, but this year have been one of the best performing asset classes. Within the equity portion of your portfolio, we typically recommend a 30% allocation to international.
Know your allocation. The chart to the right shows bonds provided a steady ride through the tariff turmoil. Stocks should outperform bonds in the long-run, but adding bonds to your mix can help reduce the pain during downturns.
Think long-term. The swift recovery that we witnessed is a good reminder not to try timing markets. Emotions can run high when markets are volatile. With confidence in your allocation and long-term plan, perhaps you can begin to look at short-term volatility as long-term buying opportunities.
Market Valuations are at Elevated Levels

U.S. equities are trading near all time high valuations, the chart to the right shows as of June 30th, the forward price-to-earnings ratio was 22.0, well above the 30-year average of 17.0 but still below peak levels in the 1990s. In the last five years the forward P/E has averaged 19.9 according to FactSet Earnings Insight. Elevated valuations do not imply an impending sell off, as company margins are quite robust today. However, it could be prudent to consider repositioning toward bonds if you are closer to retirement or raising some cash for near term needs. Generally, you will hear from many not to sell when markets are down. On the flip side, high valuations provide reasonable opportunities to reduce risk or harvest some gains.
International Equities

In aggregate, equity returns outside the U.S. have been quite robust for the first half of 2025. The chart to the right shows 11.6% of the return in international markets has
come from a weaker U.S. Dollar (currency impact). Valuations have also improved as the trade war with the U.S. lead foreign investors to turn their investments more locally. A crucial item missing from the catalysts is earnings growth. Fiscal expansion may lead to future growth, but so far in 2025 there has not been material improvement to earnings. Historically, returns from currency and valuations are more volatile while returns from earnings are more sustainable.
Fixed Income

Bond yields remain above average versus the last 20 years. That means they should provide a little extra return while also helping to reduce volatility in your portfolio. In the long run, the starting yield is a good indicator of what your return will be. As of June 30, the yield on the Bloomberg Aggregate Bond Index was 4.5% with investment grade corporate bonds offering around 5%. The country's debt and deficits are something to be aware of and monitor. Excess exposure to longer dated bonds could pose possible threats if our country's deficits cannot be reigned in over the next decade or two. Company fundamentals are still quite strong generally. We expect defaults to remain low this year as companies continue to manage their balance sheets well.
Chart Source: John Hanock Market Intelligence, Bloomberg The Bloomberg US Investment Grade Corp (IG) Index tracks performance of the IG, Fixed Rate, taxable corporate bond market. It is not possible to invest directly in the index. Standard Deviation is a statistical measure of the historic volatility of a portfolio. Larger deviations the higher the risk. Past performance is not indicative of future returns.
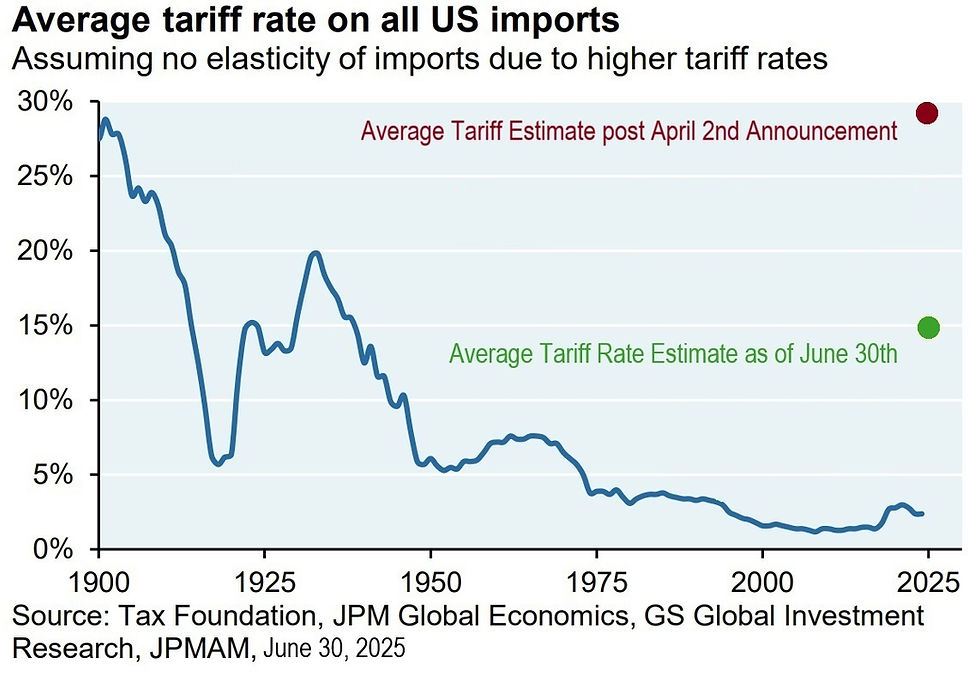
Tariff Update
The 90 day pause on most tariffs was a major turning point for markets. The S&P 500 rose 9.5% on that day alone (April 9th). It was the eighth largest single day gain since its inception. The pause was a big relief following a near 20% decline in the S&P 500 from late January to early April. It gave investors hope that President Trump would negotiate tariffs lower than the rates announced on April 2nd. The chart to the right shows JPMorgan estimates overall tariffs on U.S. imports to land around 15%, about half of the original announcement. We’re not quite there yet as of early July. Research by Deutsche Bank and Yale University indicates overall tariffs would be closer to 18-20% without further negotiations. Markets seem to be comfortable with the tariffs as long as the negotiations don’t sour and start to turn the other way back toward 30%. Dr. David Kelly, Chief Market Strategist for JPMorgan said tariffs collected increased from $8 billion in March, 2025 to $27 billion in June. He expects 60-70% of tariff costs will be paid by U.S. consumers. While inflation remained steady in spring, Dr. Kelly believes inflationary impacts of tariffs have been delayed, not canceled.

Economic Update
According to the Federal Reserve, growth is expected to be slower with higher inflation in 2025 that was previously thought coming into the year. Most of that is tariff related, whether actual tariffs or the associated uncertainty. The good news is that unemployment is expected to stay relatively low. Inflation should also be tame enough that the Federal Reserve can cut interest rates by about 0.50% by year end. Lower interest rates are generally good for stocks and bonds.
Big Beautiful Bill
In addition to easing tariff concerns, the progress and passing of the "Big Beautiful Bill" through the second quarter also helped lift investor sentiment. The 2017 tax cuts were made permanent. That includes corporate tax rates at 21%, which is good for stocks (corporate tax rates were 35% prior to 2017). The long-term risk is the bill did not provide a solution to the growing debt in our country, which is currently around 100% of GDP (gross domestic product) and expected gradually over the next ten years. According to Rick Rieder, CIO of Global Fixed Income at BlackRock, the risk is not that the U.S. government will not be able to fulfill its obligations, but an unforeseen shock could destabilize markets.

Conclusion
In closing, we always encourage investors to think long-term. For those of you who wish to revisit your portfolio, please contact us at 800-242-4735. For more on the markets, click on the resources tab on our website.

Spectrum Investment Advisors 6329 W. Mequon Road Mequon, WI 53092 262-238-4010 | www.spectruminvestor.com
Data as of 6/30/25 unless otherwise noted. The Dow Jones Industrial Average is comprised of 30 stocks that are major factors in their industries and widely held by individuals and institutional investors. The S&P 500 Index is a capitalization weighted index of 500 stocks designed to measure performance of the broad domestic economy through changes in the aggregate market value of 500 stocks representing all major industries. The NASDAQ Composite Index measures all NASDAQ domestic and non-U.S. based common stocks listed on The NASDAQ Stock Market. Barrel of Oil: West Texas Intermediate. Inflation Rate: CPI. The market value, the last sale price multiplied by total shares outstanding, is calculated throughout the trading day, and is related to the total value of the Index. Indices cannot be invested into directly.
To determine which investment(s) may be appropriate for you, consult your financial advisor prior to investing. All performance referenced is historical and is no guarantee of future results. All indices are unmanaged and cannot be invested into directly.
Benchmark Disclosures: Morningstar Category Averages: Morningstar classifies mutual funds into peer groups based on their holdings. The Category Average calculates the average return of mutual funds that fall within the category during the given time period. The following indexes and their definitions provide an approximate description of the type of investments held by mutual funds in each respective Morningstar Category. One cannot invest directly in an index or category average. Index returns do not reflect trading, advisory and other fees and expenses which are incurred in your actual investment accounts and would reduce your returns. Intermediate-Term Bonds: Bloomberg US Agg Bond Index–Measures the performance of investment grade, US dollar-denominated, fixed-rate taxable bond market, including Treasuries, government-related and corporate securities, MBS, ABS and CMBS. Allocation 50%-70% Equity–These funds invest in both stocks and bonds and maintain a relatively higher position in stocks. These funds typically have 50%-70% of assets in equities and the remainder in fixed income and cash. Large Cap Value: S&P 500 Value Index–Measures the performance of value stocks of the S&P 500 index by dividing into growth and value segments by using three factors: sales growth, the ratio of earnings change to price and momentum. Large Cap Blend: S&P 500 Index–A market capitalization-weighted index composed of the 500 most widely held stocks whose assets and/or revenue are based in the US. Large Cap Growth: S&P 500 Growth Index–Measures the performance of growth stocks drawn from the S&P 500 index by dividing it into growth and value segments by using three factors: sales growth, the ratio of earnings change to price and momentum. Mid Cap Value/Mid Cap Growth: S&P MidCap 400 Index–A market cap weighted index that covers the complete market cap for the S&P 400 Index. All S&P 400 index stocks are represented in both and/or each Growth and Value index. Mid Cap Blend: S&P MidCap 400 Index–Measures the performance of mid-sized US companies, reflecting the distinctive risk and return characteristics of this market segment. Small Cap Value: Russell 2000 Value Index–Measures the performance of small-cap value segment of Russell 2000 companies with lower price-to-book ratios and lower forecasted growth values. Small Cap Blend: Russell 2000 Index–Measures the performance of the small-cap segment of the US equity universe. It includes approximately 2000 of the smallest securities based on a combination of their market cap and current index membership. Foreign Large Cap Blend: MSCI EAFE NR Index–This Europe, Australasia, and Far East index is a market-capitalization-weighted index of 21 non-US, developed country indexes. Small Cap Growth: Russell 2000 Growth Index–Measures the performance of small-cap growth segment of Russell 2000 companies with higher price-to-value ratios and higher forecasted growth values. Real Estate: DJ US Select REIT Index–Measures the performance of publicly traded real estate trusts (REITs) and REIT-like securities to serve as proxy for direct real estate investment. Natural Resources: S&P North American Natural Resources Index– Measures the performance of US traded securities classified by the Global Industry Classification Standard (GICS) as energy and materials excluding the chemicals industry and steel but including energy companies, forestry services, producers of pulp and paper and plantations. Past performance is no guarantee of future results. This report is for informational purposes only and should not be construed as a recommendation or solicitation to buy or sell any security, policy or investment. PE Ratio is the measure of the share price relative to the annual net income earned by the firm per share.


