
Q4 2026 | Quarterly Newsletter

Updated: 2 days ago

Quarterly Economic Newsletter Snapshot:
Stocks held up in the third quarter even as interest rates climbed to 2026 high.
Bond prices fell as yields rose, bonds now offer higher yields.
The Federal Reserve raised rates for the first time since 2023.
Written by:

The S&P 500 returned 2.3% in the third quarter, bringing its 2026 gain to 12.8%. International stocks, measured by the MSCI EAFE Index, gained 0.8%. The Bloomberg U.S. Aggregate Bond Index, a broad measure of U.S. bonds, fell 3.5% as interest rates rose. A diversified 60-40 investment mix returned about -0.3% for the quarter and 6% year-to-date ending September 30.
Year-to-Date Returns Hold Up Amid Rising Interest Rates
From July through September the S&P 500 gained 2.3%, even as the 10-year Treasury yield rose from 4.44% to 5.29%. That is unusual, since rising yields tend to pressure stock prices. Strong corporate earnings help explain the difference. Third quarter S&P 500 earnings are on pace to grow about 29% from a year ago, the third straight quarter of growth above 25%. Valuations are not stretched by recent standards with the S&P 500 trading at 19.0 times expected earnings, close to its 10-year average of 19.1 (FactSet, Earnings Insight 10/23/26).

Not every corner of the market participated in the upward price movement. Small company stocks, measured by the Russell 2000, fell 7.2% in the quarter, but have still produced about a 14% return this year. Leadership has remained narrow, Vanguard estimates that the artificial intelligence (AI) related group now makes up about 40% of U.S. stock market value, indicating index returns lean heavily on a few themes.
The large growth category has rallied from being the worst performing category in the first quarter (January to March) all the way back to one of the top performers as of September. It is another reminder to stay diversified and disciplined with your portfolio allocation.
Why Bonds Fell When Rates Rose

Bond prices move opposite to interest rates. When yields rise, existing bonds that pay less become less valuable, and the longer a bond has until maturity, the larger the price drop. That sensitivity is called duration. The Bloomberg U.S. Aggregate fell 3.5% in the quarter. Municipal bonds, which are issued by state and local governments and often have longer maturities, fell more than 6%.
Most of the increase in rates came from real yields, meaning yields after inflation. Howard Marks of Oaktree and Michael Cembalest of J.P. Morgan both point to heavy government borrowing, with federal debt near 101% of GDP, as one reason investors may ask for more compensation to lend for long periods.

There is a useful flip side. Higher starting yields mean new bonds pay more income. J.P. Morgan estimates a one point decline in rates could lift the Aggregate index roughly 11% over twelve months. With higher yields today, bonds should serve as ballast when stocks stumble.
The Fed Raises Rates for the First Time Since 2023
On September 16, the Federal Reserve raised its target range for the federal funds rate, the rate banks charge each other overnight, to 3.75% to 4.00%. It was the first increase since 2023, and the vote was unanimous. Recent inflation is the reason. The Consumer Price Index peaked at 4.2% in May and ran between 3.3% and 3.5% through the summer, with higher oil and gasoline prices a major driver. The September reading of 3.72%, released after quarter end, shows the pressure has not yet faded.
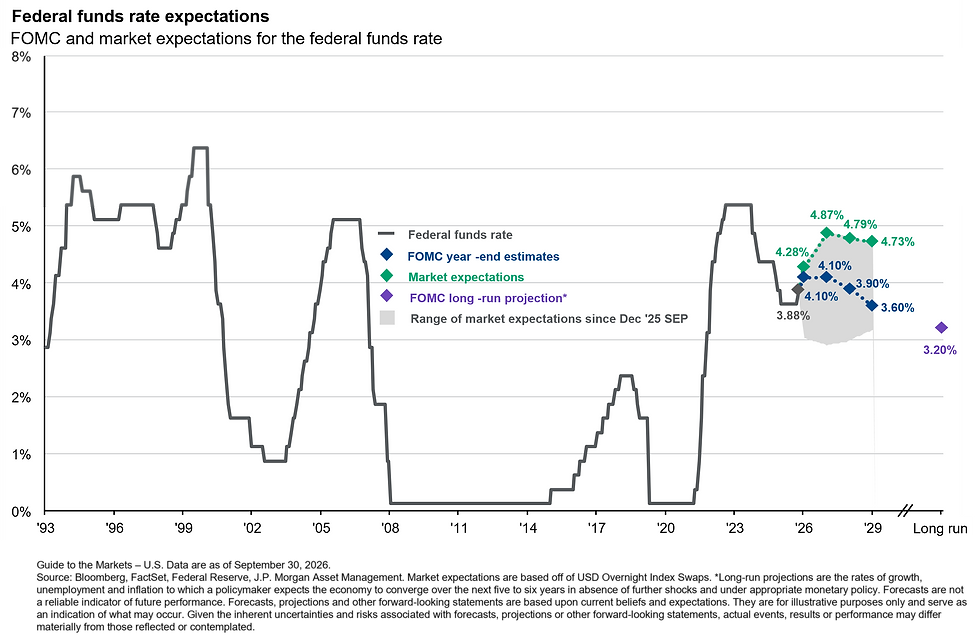
According to the Fed's projections, 16 of 18 officials expect at least one more increase this year in December. In the October WSJ Survey of Economists, the average probability of a recession over the next 12 months is relatively low at 24.1%, down from 33.0% a year ago, given the Fed comfort in tightening financial conditions.

U.S. Economic Update
Economists surveyed by The Wall Street Journal expect GDP growth of about 2.4% in 2026, unemployment near 4.2%, and inflation ending the year near 3.5%. Hiring has slowed: payroll gains averaged about 50,000 a month over the last three months, and September added just 29,000 jobs. Consumers are divided. Spending has held up among higher earners, but the savings rate has fallen to 2.7% and consumer sentiment is 48.1, far below its 77.2 average, so pressure is greatest on lower and middle income households. Mortgage rates near 7.4%, up from about 6.2% in January, continue to weigh on housing.
Global Debt Update
Protests in France began in September with high school students objecting to teacher shortages and overcrowded classrooms, and they grew into nationwide cost-of-living demonstrations as fuel prices rose. Labor market data helps explain the frustration. According to INSEE, France's unemployment rate for 15- to 24-year-olds reached 21.6% in the second quarter, up 2.5 percentage points from a year ago, while overall unemployment rose to 8.3%, its highest level since 2020. In the U.S., the Bureau of Labor Statistics

reported youth unemployment of 9.1 % in July, below its long-run median and down from 10.8% a year earlier.
For investors, the takeaway is about the delicate balance of government budgets. France faces competing demands to fund public services while reining in debt, a tension many large economies share. The France situation connects directly to the rise in rates discussed earlier. These forces play out over years, not quarters, and a portfolio diversified across regions and asset classes remains a dependable way to manage them.
Midterm Elections
"Ignore the noise" is a common mantra for long-term investors. Election seasons can get very noisy. Remember that markets respond to earnings, interest rates, and growth over time and earnings and the economy have been in a strong position. According to BlackRock, the S&P 500's 12.7% gain through September is the fifth best start to a midterm year on record. In the 15 best starts, the index averaged a further 23.3% over the next 12 months, though past performance is not a guarantee future results.
Conclusion
This quarter showed two things at once: stocks can climb while bonds struggle, and the reasons rarely fit in a single headline. Rising rates, a Fed increase, and an election are all real, but none of them changes the plan built around your goals. We cannot know what comes next. A diversified portfolio, patience, and a long time horizon are the most dependable tools we have.


Spectrum Investment Advisors 6329 W. Mequon Road Mequon, WI 53092 262-238-4010 | www.spectruminvestor.com
Benchmark Disclosures: Morningstar Category Averages: Morningstar classifies mutual funds into peer groups based on their holdings. The Category Average calculates the average return of mutual funds that fall within the category during the given time period. The following indexes and their definitions provide an approximate description of the type of investments held by mutual funds in each respective Morningstar Category. One cannot invest directly in an index or category average. Index returns do not reflect trading, advisory and other fees and expenses which are incurred in your actual investment accounts and would reduce your returns. Intermediate-Term Bonds: Bloomberg US Agg Bond Index–Measures the performance of investment grade, US dollar-denominated, fixed-rate taxable bond market, including Treasuries, government-related and corporate securities, MBS, ABS and CMBS. Allocation 50%-70% Equity–These funds invest in both stocks and bonds and maintain a relatively higher position in stocks. These funds typically have 50%-70% of assets in equities and the remainder in fixed income and cash. Large Cap Value: S&P 500 Value Index–Measures the performance of value stocks of the S&P 500 index by dividing into growth and value segments by using three factors: sales growth, the ratio of earnings change to price and momentum. Large Cap Blend: S&P 500 Index–A market capitalization-weighted index composed of the 500 most widely held stocks whose assets and/or revenue are based in the US. Large Cap Growth: S&P 500 Growth Index–Measures the performance of growth stocks drawn from the S&P 500 index by dividing it into growth and value segments by using three factors: sales growth, the ratio of earnings change to price and momentum. Mid Cap Value/Mid Cap Growth: S&P MidCap 400 Index–A market cap weighted index that covers the complete market cap for the S&P 400 Index. All S&P 400 index stocks are represented in both and/or each Growth and Value index. Mid Cap Blend: S&P MidCap 400 Index–Measures the performance of mid-sized US companies, reflecting the distinctive risk and return characteristics of this market segment. Small Cap Value: Russell 2000 Value Index–Measures the performance of small-cap value segment of Russell 2000 companies with lower price-to-book ratios and lower forecasted growth values. Small Cap Blend: Russell 2000 Index–Measures the performance of the small-cap segment of the US equity universe. It includes approximately 2000 of the smallest securities based on a combination of their market cap and current index membership. Foreign Large Cap Blend: MSCI EAFE NR Index–This Europe, Australasia, and Far East index is a market-capitalization-weighted index of 21 non-US, developed country indexes. International Developed Stocks: MSCI EAFE NR Index. Emerging Stocks: MSCI Emerging Markets Index-captures large and mid cap representation across 24 Emerging Markets (EM) countries. Small Cap Growth: Russell 2000 Growth Index–Measures the performance of small-cap growth segment of Russell 2000 companies with higher price-to-value ratios and higher forecasted growth values. Real Estate: DJ US Select REIT Index–Measures the performance of publicly traded real estate trusts (REITs) and REIT-like securities to serve as proxy for direct real estate investment. Natural Resources: S&P North American Natural Resources Index– Measures the performance of US traded securities classified by the Global Industry Classification Standard (GICS) as energy and materials excluding the chemicals industry and steel but including energy companies, forestry services, producers of pulp and paper and plantations. Past performance is no guarantee of future results. This report is for informational purposes only and should not be construed as a recommendation or solicitation to buy or sell any security, policy or investment. PE Ratio is the measure of the share price relative to the annual net income earned by the firm per share.

